
The UK is frequently cited as an example of why gas is “needed” in a clean energy transition, but the government’s own forecasts shows gas will be in rapid decline.
Graph of the day: Gas is not so needed in UK’s power plan
RenewEconomy
News and analysis for the clean energy economy
The UK is frequently cited as an example of why gas is “needed” in a clean energy transition, but the government’s own forecasts shows gas will be in rapid decline.

Most energy produced when fossil fuels burned is wasted. The transition to electricity and renewables will change this.
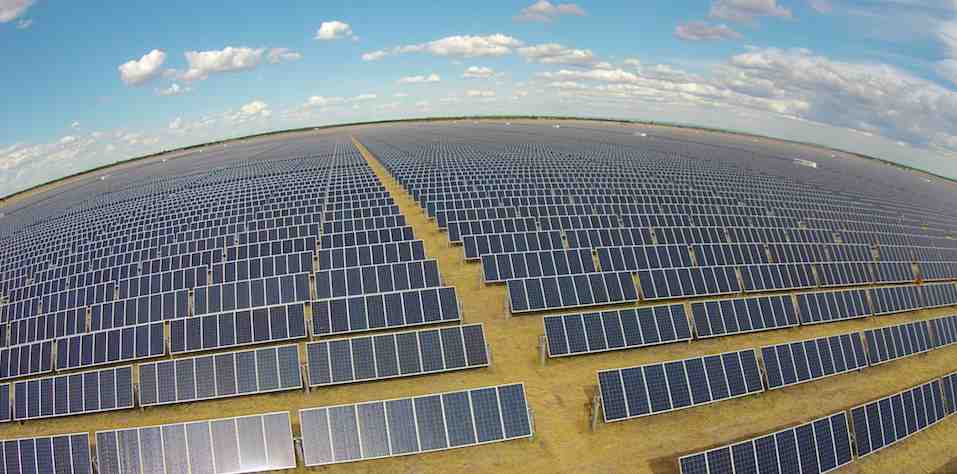
Solar is now regularly reaching 50 per cent of electricity demand in Western Australia.

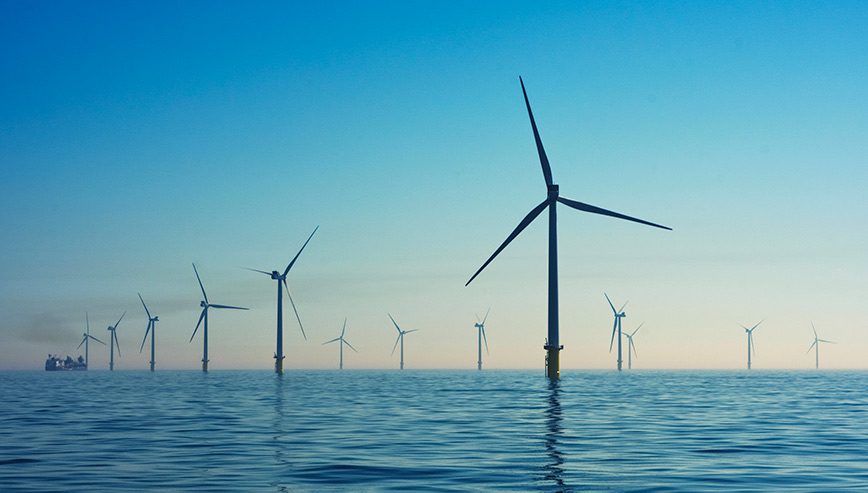
Fossil fuels keep losing out in Europe, even as energy demand returns to normal.

Grattan Institute argues gas will only ever play a part role in Australia’s electricity system, and Morrison should cease ‘indulging in wishful thinking’.
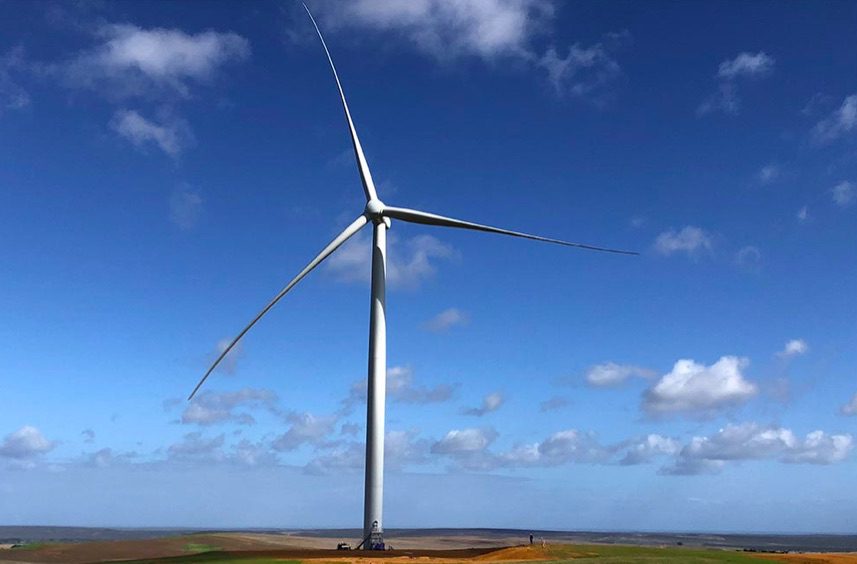
Western Australia wind farms take top positions in latest table assessing performance of Australia’s wind projects.

New IEA report says renewables immune to impact of Covid-19, but not to policy failures – but will still overtake coal within five years as number one source of generation.

Under all scenarios for Australia’s electricity market, the outcome for gas-fired generation is the same: It comprises only a tiny fraction of total annual energy output.
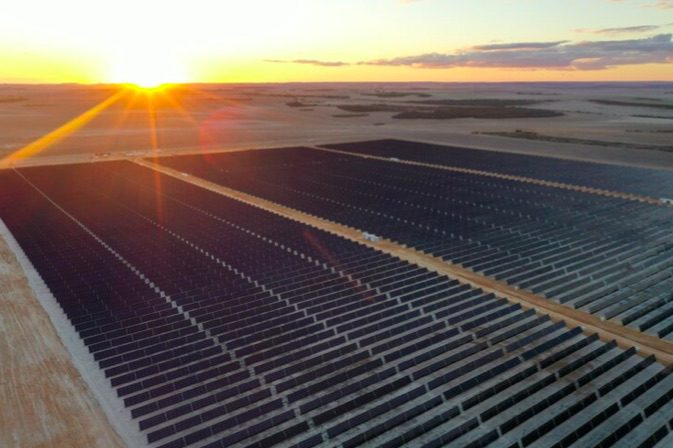
Some surprises, and some solar industry originals, feature among the best performing solar farms in Australia in October.

Australia’s main grid reaches more than 50 per cent renewables share on Tuesday, despite closure of seven solar farms and a major wind farm for grid maintenance.


